
Report

Stop Coordinated Fraud

Detect fraud rings with graph and protect revenue at scale

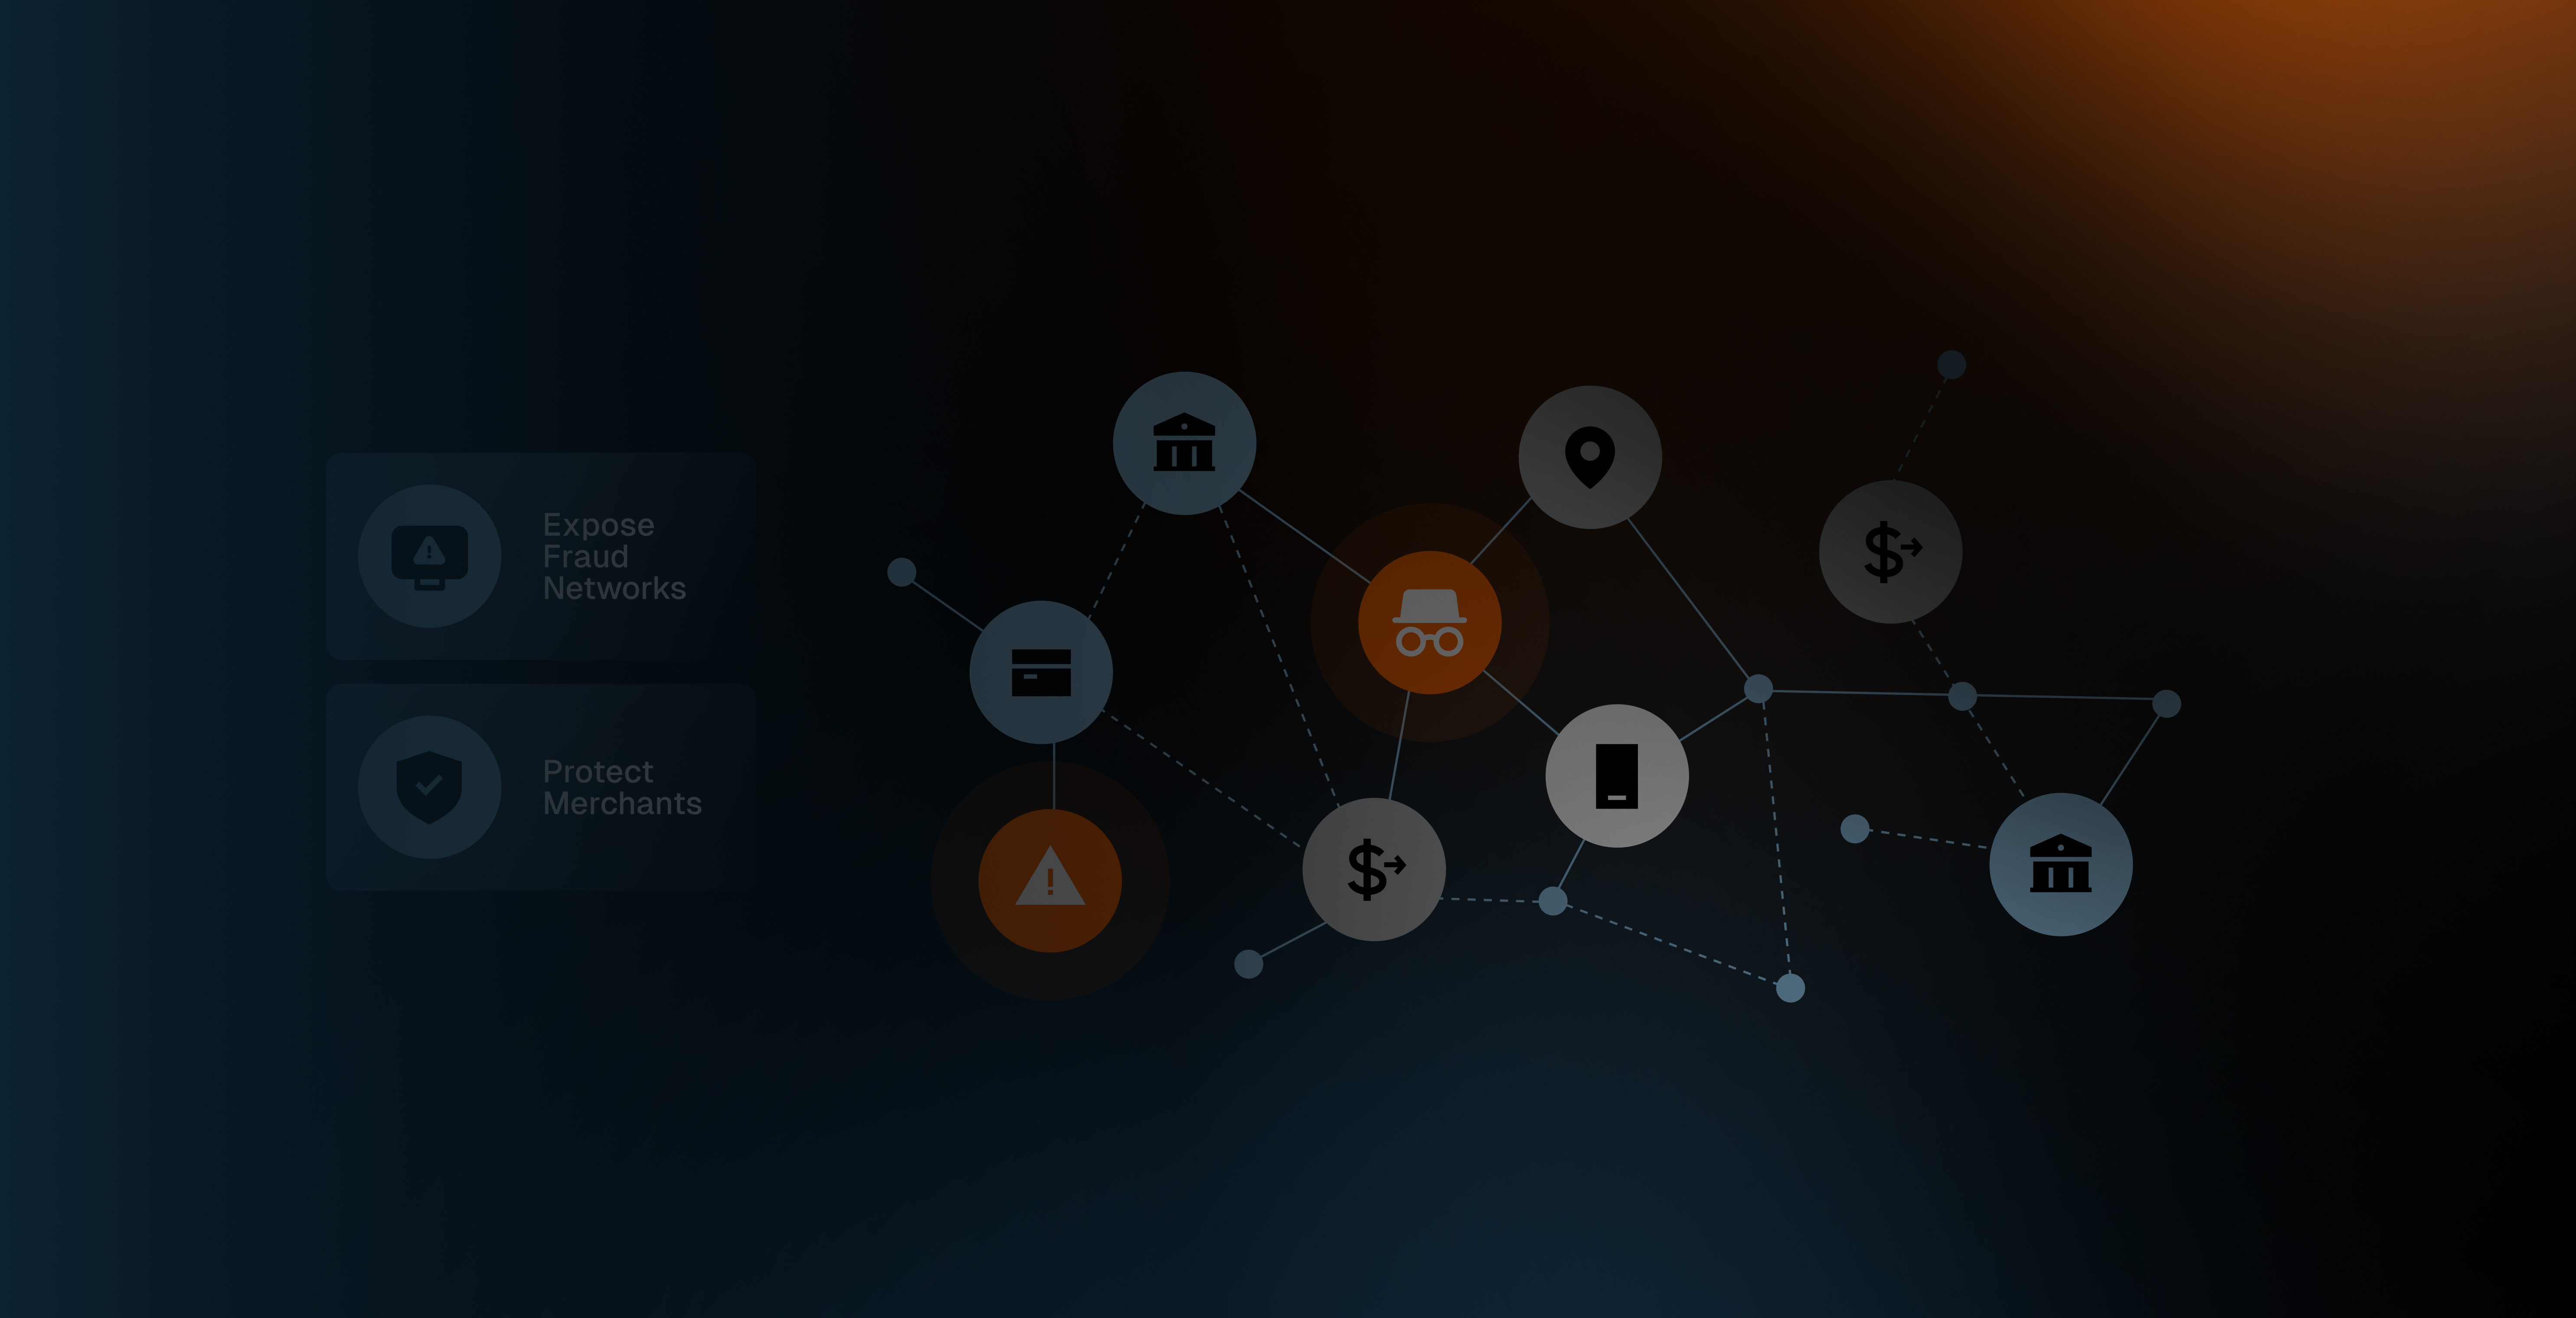
A single fraudulent account often looks normal. A ring of them sharing devices, addresses and payment paths does not, if you can see the connections. This report shows how leading banks use graph algorithms to expose coordinated fraud that rules and record-level models miss, improve their AI models and prove the return, backed by Forrester data.


Download the free report

Clients_Logo-Nov-21-2025-08-20-07-5352-PM
Clients_Logo-14
Clients_Logo-13
Clients_Logo-12
Clients_Logo-11
Clients_Logo-10
Clients_Logo-9
Clients_Logo-8
Clients_Logo-7
Clients_Logo-6
Clients_Logo-5
Clients_Logo-4
Clients_Logo-3
Clients_Logo-2
Clients_Logo-1

Key findings

8429366_ecommerce_shopping_online_attention_magnifier_icon 1

3x better recall

Graph features helped fraud models catch up to three times more coordinated fraud.

8388125_2business_finance_office_organize_structure_icon 1

229% ROI

229% ROI, with payback in under six months, according to a Forrester Total Economic Impact study.

8463505_human_anatomy_body_brain_organ_icon 1

Rings show up in shared links

Common devices, IPs, addresses and transfer paths are the strongest signals of coordinated fraud.

8441437_essential ui_app_web_protection_shield_icon 1

Proven at scale

JPMorgan Chase and Nubank use graph analytics to find fraud rings and show measurable returns.

What the report covers

✓

Why record-level systems miss coordinated fraud

✓

The six graph algorithms behind fraud detection, AML and KYC

✓

How JPMorgan Chase and Nubank detect fraud rings with graph

✓

Using graph features to improve recall and cut false positives

✓

Forrester-validated ROI and how to build the business case

Who should read it

Fraud prevention and risk leaders at banks, payment providers and fintechs facing organized fraud, mule networks or account takeover at scale.

Fraud ring detection, answered

What is a fraud ring?

A fraud ring is a group of fraudsters, or fake identities they control, working together. They share resources such as devices, addresses, phone numbers and accounts to open credit lines, move money or abuse promotions. Each account may look legitimate alone, so the ring only appears when you look at the connections.

How do you detect fraud rings with graph analytics?

Map the relationships between accounts, then look for clusters that share identifiers or move money between each other. Community detection, connected components and centrality algorithms find these clusters quickly, even across billions of records, and score how risky each one is.

Which graph algorithms work best for fraud detection?

Community detection finds rings, connected components group linked accounts, PageRank and other centrality measures find key players, shortest path traces money between accounts, and similarity algorithms match shared identifiers. The report covers the six algorithms banks use most.

How do graph databases detect fraud compared to relational databases?

Fraud patterns are made of relationships. A graph database stores and queries those relationships directly, so multi-hop checks that need slow joins in a relational database run in real time. That lets banks score transactions and new accounts against the network before money leaves.

Stop fraud rings before they scale

Download the report for the full algorithms and case studies. Ready to see it on your data? Book a TigerGraph demo.

Download the free report