TigerGraph provides 600% ROI
and $20.81M in Value
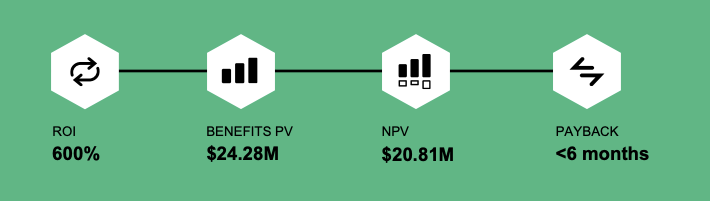
Forrester Consulting has examined the impact on profitability that TigerGraph can deliver to an enterprise. Forrester's analysis was modeled on a hypothetical business (composite organization) aggregated from interviews with several TigerGraph customers.
Read this study to learn how these customers were able to increase revenue, reduce fraud, retire legacy systems, and improve productivity with TigerGraph.
- Increased profits from new products and services by $9.6 million over three years
A greater understanding of customers and organizational data through fast and powerful analysis can open a wide variety of avenues for organizations to provide new products and services, attract new customers, and generate new revenue resulting in increased profits. - Reduced fraud loss costs by 10%
With TigerGraph, organizations could harness the power of data to target fraudulent activity with precision and most effectively allocate resources to stop bad actors. - Lowered costs of legacy infrastructure by $2.1 million over three years
Adopting TigerGraph may enable efficiencies in hardware and software, making it possible to safely retire legacy systems. - Improved productivity of data science teams by 70%
The data teams can save time spent performing analysis and managing data and engineering databases. - Improved productivity of customer service teams by 20%
Powerful visualizations that united data from multiple sources combined with no-code/low-code features could allow nontechnical users to react and provide better, more efficient service, increasing productivity.
These results are based on a commissioned study conducted by Forrester Consulting on behalf of TigerGraph, The Total Economic Impact™ of TigerGraph, April 2022. They are based on a composite organization and the total economic impact of TigerGraph on your organization may differ.