
whitepaper
April 1, 2026

50 Graph-Based Risk Signals for: AML and Financial Crime

Traditional AML misses the relationships behind financial crime. Learn 50 graph-based risk signals that reveal hidden networks, expose indirect risk, and improve detection with connected, explainable intelligence. 

Get Your Free Ebook

Clients_Logo-Nov-21-2025-08-20-07-5352-PM
Clients_Logo-14
Clients_Logo-13
Clients_Logo-12
Clients_Logo-11
Clients_Logo-10
Clients_Logo-9
Clients_Logo-8
Clients_Logo-7
Clients_Logo-6
Clients_Logo-5
Clients_Logo-4
Clients_Logo-3
Clients_Logo-2
Clients_Logo-1

Why Graph Now

8429366_ecommerce_shopping_online_attention_magnifier_icon 1

See relationships

Understand how people, accounts, devices, transactions, and documents connect.
8388125_2business_finance_office_organize_structure_icon 1

Detect patterns faster

Surface multi-hop relationships that traditional queries often miss.
8463505_human_anatomy_body_brain_organ_icon 1

Explain decisions

Trace why a recommendation, alert, or risk score was produced.
8441437_essential ui_app_web_protection_shield_icon 1

Power better AI

Give AI systems structured context beyond text similarity.

Graph vs Traditional Systems

Tables show what happened. Graph shows how it connects

Traditional Approach

Key Points:
  • Looks at individual records
  • Requires complex joins
  • Hard to explain multi-step patterns
  • Slower for relationship-heavy questions
  • Limited AI context

Graph Approach

Key Points:
  • Looks at relationships between records
  • Traverses connected data naturally
  • Makes paths and connections visible
  • Built for connected queries
  • Strong foundation for GraphRAG and reasoning

Proven Results from Industry Leaders

Real impact data from banks leveraging graph algorithms.

$100M+

Annual fraud savings across top global banks.

229% ROI

Return on investment with <6-month payback.

40% Faster

AML case resolution with 30% earlier intervention.

$50M+

Annual savings at JPMorgan Chase with 25% higher accuracy.

How It Works

Real impact data from banks leveraging graph algorithms

Step 1

Ingest

Understand how people, accounts, devices, transactions, and documents connect.

Step 2

Connect

Map entities and relationships into a graph structure.

Step 3

Query

Ask relationship-aware questions across multiple hops.

Step 4

Act

Power alerts, dashboards, AI agents, investigations, and decision systems.

What is a 
Knowledge Graph?

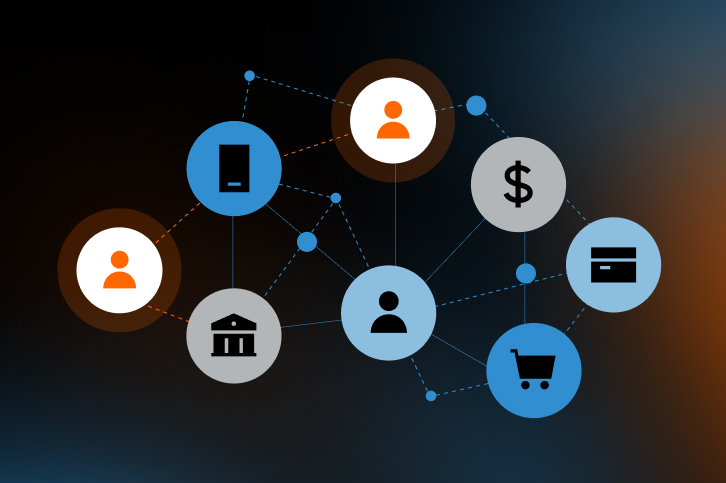
A knowledge graph is a design pattern for storing, organizing, and accessing interrelated data entities, including their semantic relationships. With knowledge graphs, you can better understand your data and build more intelligent applications.

knowledge

What You'll Discover Inside

Real impact data from banks leveraging graph algorithms

Why traditional systems fall short

The architectural reason relationship-heavy problems become slow and expensive.

Where graph fits

How graph works alongside databases, AI systems, and existing analytics tools.

What to prioritize first

The highest-value use cases for fraud, risk, AI, and enterprise search.

How to evaluate ROI

Metrics to use when making the business case for graph adoption.

Start seeing the connections your systems are missing.

Download the executive summary and learn how graph can help your team move faster, reason better, and make decisions with connected context.

→ GET YOUR FREE EBOOK